Saturday, 31 March 2012

Hopping Easter US Retail Statistics


March 31, 2012 
The National Retail Federation (NRF) has released some estimated retail statistics for US consumer spending in the 2012 Easter period.   This could be noted as more positive economic indicators, with projected spending to increase for this year’s season.  Retail entrepreneurs and business owners should tune-in to lucrative events in the annual calendar, as all pose to be potentially lucrative if you tap into some niche retail areas.
Here are some highlights on 2012 estimated US retail spending around Easter, based on a NRF survey:
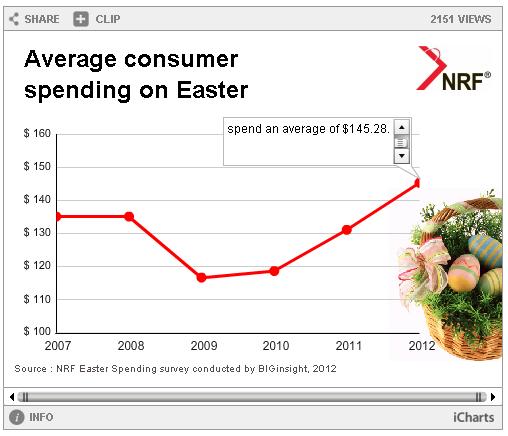
  • Estimated average spending on retail merchandise, food, candy: $145.28
  • 2012 estimated average spending is up by +11% over 2011 ($131.04)
  • Total estimated retail spending for Easter 2012:  A big $16.8 Billion
Easter Calendar - spending
Here are the biggest categories in a breakdown of the estimated retail spending around Easter 2012:
  • Fashion & Accessories:  $3.0 Billion
  • Easter Candy:  $2 Billion
  • Easter meals & food:  $5.1 Billion
  • Easter gifts & cards:  $2 Billion
It is interesting to note that the average estimate spending is $44.34 for Easter meals, $20.57 for Easter Gifts, $10.50 on flowers, $9.07 for Easter decor, and from the half that buy greeting cards, an average of $7.04 on greeting cards.

Easter Shopping

Some interesting trends are highlighted in this NRF survey around how and where consumers will shop:
  • 63.5% will shop at the local discount store
  • 42.6% will shop at a department store for gifts; highest percent in the survey’s history
  • 8.7% will shop online, represents a 4% increase over last year
  • 25.4% will shop at a specialty retail store
Similar to other calendar events, Easter consumer retail spending can bring significant revenues to your business, if you target customers in niche areas.  If you are in retail in these areas, do not overlook the power of retail during special periods.  Plan well in advance for periods of retail opportunities.
Business information, resources and tips for the entrepreneur
© 2012 Strategy Plan One
Friday, 30 March 2012

Trends in the Growing Online Wine Sales Industry (infographic)


March 30, 2012 
Here are some interesting statistics and trends in the online wine sales industry in this infographic, courtesy of  Neo Mammalian Studios.  Tapping into the growing online wine sales market can be very lucrative.  One company, Garagiste, with sales of $30M per year, started on an initial investment of $500.
Statistics and Trends:
  • Lot 18 – over half a million members
  • Average range of prices for a bottle of wine online:  $20 – 37
  • Average range of discounts for wine online: 30 – 51% 
  • Page views for at least two online wine sales companies: over 600,000 per month (Jan 2012)
wine trends - online wine sales
Business information, resources and tips for the entrepreneur

Thursday, 29 March 2012

Mommy Blogger Domination [Infographic]


March 29, 2012 
The big business world of Mommy Blogging is illustrated brilliantly in this infographic below, courtesy of infographicsarchive.com.

Mommy blogger huge numbers:

  • 4.2 Million Mommy bloggers and growing  
  • 33% of bloggers are Moms
  • Social Media – 79% of Moms are active on social media
  • Over 81 Million women active in social media on a weekly basis
  • US Moms spend $2.1 Trillion per year
mommy blog
Business information, resources and tips for the entrepreneur
© 2012 Strategy Plan One

Wednesday, 28 March 2012

Power of Retail – Staggering Economic & Business Numbers


March 28, 2012
The National Retail Federation (NRF) website is an excellent source of information on the retail industry in the US.  Here are some amazing statistics, courtesy of NRF:

 Retail Jobs and Industry Statistics 

  • Retail Establishments                     3,617,486
  • Direct Retail Employment             28,113,476
  • Total Retail Employment Impact   41,620,604
  • Direct Labor Income                      $770 billion
  • Total Labor Income Impact          $1.49 trillion
  • Direct Impact on GDP                    $1.2 trillion
  • Total Impact on GDP                    $2.48 trillion

 Retail Job Information  US Retail Jobs Information Cloud

Retail supports 1 in 4 American jobs.
Retail is directly and indirectly responsible for 18% of the U.S. GDP.
Retail directly and indirectly generates 17% of the U.S. labor income.
Retail Jobs supports 41,620,604 jobs in the U.S.
Business information, resources and tips for the entrepreneur
© 2012 Strategy Plan One